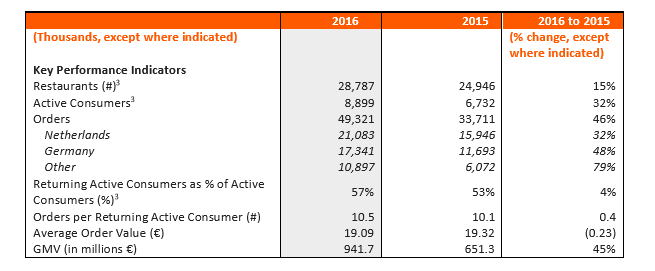
• Takeaway.com processed 49.3 million orders in 2016, representing an order growth of 46% compared with 2015, further cementing its market leadership positions in its five Leading Markets (the Netherlands, Germany, Belgium, Austria and Poland).
• In the Leading Markets, the company had approximately a 62% share of the online food delivery marketplaces in 2016, up from 57% in 2015. Takeaway.com accounted for almost the entire growth of the online food delivery marketplaces in these markets. In each of the Leading Markets, Takeaway.com is now significantly larger than the number two.
• In all Leading Markets, Takeaway.com’s marketing budgets far exceeded those of the number two, resulting in the highest visibility and brand awareness in these markets.
• Our network effects have been strengthened which is reflected by an increase in Active Consumers, returning Active Consumers and order frequency of returning Active Consumers in all our Leading Markets.
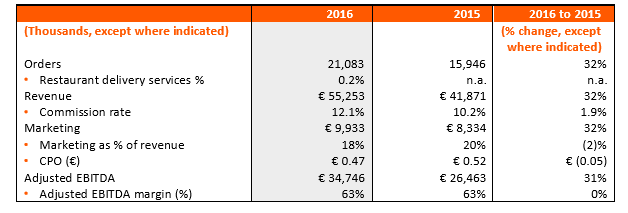
• Netherlands’ EBITDA further increased to €34.7 million in 2016, resulting in an Adjusted EBITDA margin2 of 63%, the same level as 2015.
• Germany and Other markets had negative EBITDA due to significant investments to fuel growth and to reach the scale necessary to become profitable. • In 2016, Takeaway.com launched Scoober, our restaurant delivery services, which is currently operating in 17 European cities for restaurants without own delivery, thereby expanding our restaurant offering to consumers and enhancing our network effects. However, we currently do not believe that Scoober is going to contribute significantly to our profits.
• Takeaway.com made four strategic acquisitions (Just Eat Benelux, Food-Express, Tante Bep and Restoin) in line with its strategy to further expand its leadership positions.
• Takeaway.com ceased its operations in the United Kingdom in August 2016, demonstrating its disciplined portfolio management by exiting markets in which there is no clear path to market leadership. This is expected to deliver net savings of approximately €1 million per annum.
• The successful Initial Public Offering (“IPO”) provided Takeaway.com with capital to strengthen its operations, fund investments in future growth and enhance financial flexibility.
• Takeaway.com will continue its strategy to further improve its offering to consumers and restaurants through investments in technology, marketing, product development, expansion of Scoober and recruitment of staff.
• Takeaway.com reiterates its financial and operational medium term objectives as communicated at the time of the IPO.
• Per 1 January 2017, the company increased its effective commission rate by around 0.8% in both Germany and Other, which will lead to an average commission rate of approximately 10% in Germany and ca. 10.5% in Other.
Takeaway.com N.V. (AMS: TKWY), hereinafter the “company”, or together with its group companies “Takeaway.com”, the leading online food delivery marketplace in Continental Europe, hereby reports its financial results for the full year 2016. In addition, Takeaway.com published its annual report 2016. The report can be viewed or downloaded as a PDF file at our corporate website: https://corporate.takeaway.com.
“2016 has been an exciting and eventful year for Takeaway.com. We made four strategic acquisitions and successfully listed our company at Euronext Amsterdam. Founded in 2000, Takeaway.com has grown mostly organically to become the leading online food delivery marketplace in Continental Europe. We have increased our highly recurring and predictable consumer base, which led to strong order and revenue growth in 2016.
I am especially proud of the acceleration in our growth that we have shown right after the IPO. Showing that our company was able to keep its focus, despite having the arguable distraction of an IPO. Our order growth overall was strong, especially in the fourth quarter of 2016. In Germany, where we established clear market leadership, our share in terms of orders is now approximately as large as that of the number two and number three websites combined, demonstrating both our progress and determination.
We are confident we can deliver on the medium term objectives as set at the time of the IPO and we will continue to invest in our offering to our consumers and restaurants through technology, marketing, product development and our Scoober restaurant delivery services. We are well-positioned for further growth as we have seen more consumers order food online more frequently.”
At Takeaway.com we believe that our business model offers highly attractive economics. In our first and largest market, the Netherlands, we achieved an (post headquarter allocation) EBITDA margin of 63% in 2016, which was consistent with the previous year, despite a 32% growth in orders and revenues. While our peers do not provide fully comparable profitability figures, we believe that our Dutch business is the most profitable marketplace in the online food delivery industry globally.
In addition to the Netherlands, our Belgian business was profitable on a full year 2016 basis. This was as a result of both organic growth and the Just Eat Benelux acquisition. We are not yet profitable in our other markets due to the high marketing expenses required to build brand awareness and market share. We consider these expenses to be an upfront investment with the potential for an attractive return over the longer term.
Management is confident to achieve the following medium term objectives, as set at the time of the IPO:
• Takeaway.com aims for order growth to exceed 25% per annum in the medium term (targeting greater than 30% compounded annual growth rate (CAGR) from 2015 to 2018);
• Takeaway.com is seeking to achieve revenue growth which continues to exceed order growth after 2016;
• Takeaway.com is seeking to achieve a positive EBITDA margin for both its Germany segment and the company as a whole within two to three years following its IPO; and
The group's ability to achieve these objectives will depend upon a number of factors outside of its control, including significant business, economic and competitive uncertainties and contingencies.
The financial information included in the CFO update and financial review is derived from the annual report 2016. The annual report is yet to be adopted by the General Meeting. The company’s Annual General Meeting is scheduled to be held on 18 May 2017. In accordance with section 393, Title 9, Book 2 of the Netherlands Civil Code, Deloitte Accountants B.V. has issued an unqualified auditors’ opinion on the annual report.
Consolidated statement of profit or loss and other comprehensive loss for the year ended 31 December

Revenue consists of commission revenue, online payment services revenue and other revenue items such as merchandising revenue and white label revenue. In particular, the first two revenue items are fully driven by an increasing number of orders combined with increased average commission rates, as well as continued adoption of online payment methods by consumers

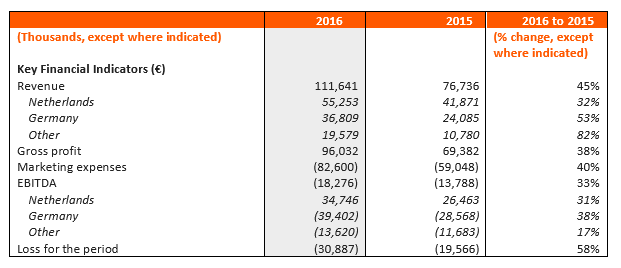
In 2016, Takeaway.com generated revenue of €111.6 million, a 45% increase from €76.7 million in 2015. The increase in revenue in 2016 was the result of growth in orders in each of our Leading Markets as well as increased average commission rates in the Netherlands and Austria. Revenue growth was largely achieved organically during this period.
Commission revenue was €99.9 million in 2016, representing 89% of total revenue compared to 80% in 2015. This increasing share was caused by the increased average commission rates in the Netherlands and Austria, the introduction of the €0.19 administrative fee per order in the Netherlands (which is classified as commission revenue), and the reduction in payment services revenue in the Netherlands.
Despite that the percentage of orders paid online increased to 51% in 2016 from 46% in 2015, revenue from online payments decreased to €8.1 million in 2016 from €12.0 million in 2015. This drop was fully caused by the reduced online payment charges in the Netherlands which were introduced at the beginning of 2016.
Revenue from other revenue items grew to €3.6 million in 2016 from €3.0 million in 2015. Compared with the growth of the total revenue of 45%, revenue from other revenue items was slower and is attributable to Germany where revenue from these items decreased due to the gradual removal of subscription contracts with restaurants entered into prior to the group’s acquisition of Yourdelivery.
The group’s Cost of Sales was €15.6 million in 2016, which represented a 112% increase from €7.4 million in 2015. The increase in cost of sales was significantly higher than the growth in orders and was largely the result of the roll-out of Scoober, which added €4.5 million to the Cost of Sales in 2016. Excluding the impact of Scoober, Cost of Sales increased by 51% year on year, which was broadly in line with revenue growth.
Gross margin declined to 86% in 2016 from 90% in 2015 mainly due to expenditures incurred following the launch of our restaurant delivery services. Excluding the impact of Scoober, the gross margin would have remained constant at 90%.
Staff costs (excluding the employee bonus share expense of €0.8 million) were €19.9 million in 2016, which represented a 43% increase from €13.9 million in 2015. The increase in staff costs in 2016 was driven by continued hiring of staff across all of our countries. In order to manage our growth and to prepare for the IPO and for our future as a listed entity, we have expanded our staff and further professionalized our teams with more senior staff. As a result, excluding drivers (the costs of whom are captured in Cost of Sales), staff costs rose faster than FTEs in 2016.
The (one-off) employee bonus share expense of €0.8 million relates to shares granted by a number of shareholders to employees at the Initial Public Offering on 30 September 2016.
Long-term employee incentive costs relate to the fair value expense of share-based payments for employees in a particular year. Our long-term employee incentive costs were €227 thousand in 2016, which represented an 86% increase from €122 thousand in 2015. Expenses recognised in 2016 relate to the existing option arrangements in place before the IPO and the new long-term incentive plan implemented post-IPO.
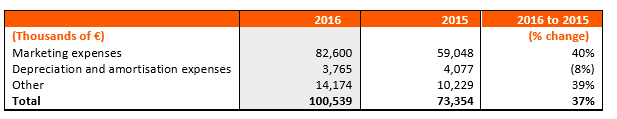
Other operating expenses comprise marketing expenses, depreciation and amortisation costs, housing expenses, other staff-related expenses, temporary staffing expenses, charges for doubtful debts, and other operating expenses.

The largest component of other operating expenses is marketing expenses. This includes all external expenses related to marketing and can be divided into performance marketing and brand awareness marketing. Performance marketing represents costs related to pay-per-click marketing such as search engines and affiliate marketing. Brand awareness marketing expenses include amongst others: television, radio, outdoor advertising, and merchandising for restaurants.
Marketing costs in 2016 increased by 40% compared with 2015. In all our Leading Markets, we intensified our marketing efforts. In particular, in Germany and Poland we significantly accelerated our brand awareness marketing which was one of the major drivers of our order growth. The efficiency of marketing, both as a percentage of revenue, and as marketing costs per order, improved.
Our depreciation and amortisation expenses were €3.8 million in 2016. This reflects expenses related to the intangible assets recognised as a result of the acquisition of Yourdelivery (Lieferando.de and Pyszne.pl) in April 2014 as well as the amortisation of new intangible assets acquired in the Just Eat Benelux acquisition.
The other component of our other operating expenses was €14.2 million in 2016, which represented a 39% increase from €10.2 million in 2015. This increase in 2016 was primarily due to increased housing expenses and staff-related costs as a result of the increase in staff and the opening of new premises in Amsterdam, as well as increased professional and consulting fees incurred by the group during 2016.
Our net finance costs were €1.8 million in 2016, which represented a 231% increase as compared with 2015 as a result of amounts borrowed under the overdraft and revolving credit facilities which were in place prior to the IPO, as well as the bridge loan which was raised for the Just Eat Benelux acquisition. The overdraft facility, revolving credit facility, and bridge loan agreement were terminated by Takeaway.com after the IPO.
At year-end Takeaway.com owned 53% of Takeaway.com Asia BV, which owns 99% of the shares and voting rights of Vietnammm. Takeaway.com Asia BV is accounted for as a joint venture using the equity method of accounting given that joint control exists in terms of decision-making. Takeaway.com’s share of loss in the joint venture was €0.1 million in 2016 (€0.2 million in 2015).
The group’s income tax expense amounted to €3.6 million in 2016 (€0.9 million in 2015). This was primarily a consequence of increased profits in our Dutch fiscal unity. Takeaway.com has not historically been profitable in its non-Dutch entities and, as a result, has accumulated tax losses which can be carried forward to offset future taxable income, if any. We began to recognise income tax expenses in 2014 relating to our profits in the Netherlands.
As a result of the factors described above, the group incurred a net loss of €30.9 million in 2016, which represented a 58% increase from a loss of €19.6 million in 2015.

Non-current assets, mainly consisting of goodwill, other intangible assets, and property and equipment increased to €92.3 million in 2016, mainly due to the acquisition of Just Eat Benelux and capital expenditure, partly offset by amortisation and depreciation expenses.
Changes in working capital can vary in the short term, as payments from restaurants are received on a daily basis while we pay restaurants on a weekly basis, but changes in working capital are generally insignificant over the course of a particular year. Operating working capital is structurally negative due to the difference between the restaurant and consumer payment cycles. Normalised negative operating working capital4 amounted to €21.5 million in 2016 compared with €18.1 million in 2015, a decrease of €3.4 million which was primarily driven by the timing of restaurant and other creditor payments.
Cash and cash equivalents increased from €4.4 million as at the end of 2015 to €134.6 million at the end of 2016, an increase of €130.2 million driven by the €175.0 million in equity capital that we raised from the IPO, less repayments of our credit facility, acquisition loan, payment of the IPO expenses and our operating losses.
Shareholders’ equity increased to €187.8 million from €49.4 million at the end of 2015 following the equity raise on 30 September 2016 of €175.0 million, and to a smaller extent the allocation of the loss for the year to shareholders’ equity and exchange differences of foreign operations. The solvency ratio, defined as total equity divided by total assets, was 79% as at 31 December 2016 (2015: 63%).
Non-current liabilities increased to €6.9 million in 2016 from €4.9 million in 2015, an increase of €2.0 million which was a result of the deferred tax liabilities arising as a result of the Just Eat Benelux acquisition less the tax effect of amortisation recognised during the year.

Net cash used in operating activities increased to €3.4 million in 2016 compared with €3.8 million in 2015. Net cash used in operating activities was driven by our greater operating losses and offset by an improvement in our working capital position, mostly related to timing of creditor and restaurant payments. In addition, there was a one-off positive impact on our working capital of €10.7 million comprised of the 20% holdback of the Just Eat Benelux acquisition price (€4.4 million, paid in February 2017) and a €6.3 million tax liability on options exercised during the course of the IPO which was received prior to year-end but paid in 2017. On a normalised basis, our EBITDA is correlated with operating cash flow. Our operating cash flow during the year was partially funded by the overdraft- and revolving credit facilities which were in place prior to the IPO.
Net cash flow used in investing activities was €32.1 million in 2016 principally related to the Just Eat Benelux acquisition. To a lesser extent, it was related to; the two restaurant delivery services acquisitions in Germany and the Netherlands, to investments in technology, to expenses incurred in connection with the opening of our new office in Amsterdam and leasehold improvements in our office in Berlin.
Net cash generated by financing activities increased to €165.7 million in 2016 compared with nil in 2015, due to the successful IPO of the company amounting to €179.8 million less share issue costs of €14.2 million.

Revenue in the Netherlands grew by 32% from €41.9 million in 2015 to €55.3 million in 2016. The average commission rate increased by 1.9% in 2016 compared with 2015, however revenue growth was in line with the growth of orders and GMV. This was principally the result of an increase of the commission rate and the introduction of an administrative fee of €0.19 per order which is included in commission revenue (and hence the average commission rate) on the one hand and a reduction in online payment services revenue, which was caused by a reduction in online payment charges for all payment methods in 2016 on the other hand. The reduction in these charges had a positive impact on the number of orders paid online which is beneficial for our receivable collections.
In the Netherlands, we have been able to continue growing our revenue while incurring lower marketing expense as a percentage of revenue. Marketing expenditures as a percentage of revenue declined in the Netherlands to 18% in 2016 from 20% in 2015 which demonstrates our operational leverage, resulting in order and revenue growth exceeding the rate of increase of marketing expenditures. This efficiency is also demonstrated by the further decreasing cost per order in the Netherlands.
Adjusted EBITDA increased in 2016 compared with 2015, which reflects the realisation of scale benefits as a result of our strong market position. As a percentage of revenue, the Adjusted EBITDA in the Netherlands was 63% in 2016, consistent with 2015. Despite growing pressure on the EBITDA margin due to the growth of Scoober, we target further EBITDA growth in line with our guidance.
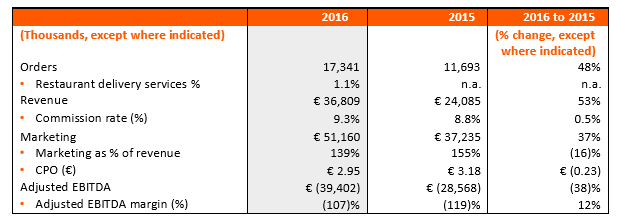
Revenue in Germany in 2016 grew to €36.8 million, a 53% increase from €24.1 million in 2015. Revenue growth during this period was slightly above our GMV growth of 52% due to the growth in our Scoober business for which we earn substantially higher commissions. This more than offset the decrease in other revenue components in Germany which arose from the gradual removal of subscription contracts with restaurants added prior to the group’s acquisition of Yourdelivery.
In Germany, our marketing expenditure in 2016 increased primarily as a result of greater expenditures in channels such as television and outdoor media advertising which was designed to further enhance our brand awareness and cement our position as market leader. Marketing costs as a percentage of revenue declined to 139% in 2016 (2015: 155%) which translates to an improved cost per order. In 2017, we expect to continue investing in marketing in order to capitalise on our current momentum and further strengthen our market position.
Adjusted EBITDA in Germany decreased in 2016 compared with 2015, predominantly due to our increased investments in marketing. For 2017 we still expect a loss as a result of the continuing investment in building market share.

Revenue in Takeaway.com’s segment Other (which includes Belgium, Austria, Poland, France, Luxembourg, Portugal, Switzerland and the United Kingdom until August 2016) grew from €10.8 million in 2015 to €19.6 million in 2016, an 82% increase. All geographies contributed to the growth. In Austria revenue was positively impacted by the increase of the average commission rate in 2016.
Marketing expenditure in these territories increased primarily as a result of increased brand awareness marketing expenditures in Poland, which we view as strategic given the market potential as well as the high growth rates in Poland. There were also less significant increases in marketing expenditures in Belgium and Austria.
Adjusted EBITDA declined in 2016 compared with 2015, again predominantly caused by the significantly higher investments in marketing. As reported in our Q3 2016 trading update, our Belgium operation was profitable on a full year 2016 basis, however, this was offset by the negative results in the other countries. We anticipate continuing to invest further in marketing in these regions which will result in a negative EBITDA for the year 2017.
To maintain our strong growth, we will continue to invest significantly in our offering to consumers and restaurants through marketing, product development, expansion of restaurant delivery services, recruitment of staff at all levels and organisational infrastructure. As a result, we anticipate a loss at group level for the year 2017, in conformity with the guidance given by the company at IPO.