Statement of Jitse Groen, CEO of Takeaway.com: “2017 was a year of tremendous order and revenue growth. It was also a year in which we invested heavily in marketing, our restaurant delivery service Scoober, product development and in further professionalising the Company. We are now by far the largest food delivery brand in our Leading Markets, which position is essential in order to grow towards profitability. Because of this strong growth, losses decreased in the second half of 2017, and we expect a further decline in 2018.”
• Revenue grew by 49% to €166.5 million in 2017 compared with €111.6 million in 2016, exceeding order growth, driven mostly by increased commission rates in the Germany and Other segments.
• Takeaway.com processed 68.3 million orders in 2017, representing an order growth of 38% compared with 2016, further cementing its market leadership positions in the five Leading Markets (the Netherlands, Germany, Poland, Belgium and Austria).
• Orders via Takeaway.com’s restaurant delivery service Scoober, represented 1.4% of total orders in 2017 versus 0.5% of orders in 2016. It is important to reiterate that the Company, in general, does not believe restaurant delivery services can be run at a profit.
• In 2017, the Netherlands segment continued to show strong order and revenue growth of 30% and 35% respectively compared with 2016. Adjusted EBITDA in the Netherlands further increased to €43.0 million in 2017 compared with €34.7 million in 2016, resulting in an adjusted EBITDA margin of 58%. This adjusted EBITDA included both accelerated investments in Scoober and headquarter costs. • Takeaway.com demonstrated its strong revenue generation capability in Germany with 57% top line growth, well in excess of 38% order growth. Takeaway.com remains committed to significant investments in Germany in order to further expand its market share.
• Revenue in the segment Other grew by 75% to €34.2 million in 2017 compared with €19.6 million in 2016. Order growth in Poland, Austria and Belgium remained at high levels and Takeaway.com is the clear market leader in each of these countries in terms of orders. Poland remains a significant long-term growth opportunity.
• In February 2018, Takeaway.com strengthened its position in Eastern Europe with the acquisition of BGmenu in Bulgaria and Oliviera in Romania, in line with the strategy to further expand its leadership position on the continent. Takeaway.com will significantly invest in both Bulgaria and Romania.
• Adjusted EBITDA1 for the Company was minus €27.6 million in 2017 compared with minus €18.3 million in 2016, caused by significant investments in marketing, Scoober and further investments to professionalise the organisation, as part of its growth strategy. Although investments will continue, management expects absolute losses to decrease going forward. Adjusted EBITDA improved to minus €12.1 million in the second half year of 2017 from minus €15.5 million in the first six months of 2017.
• From 1 January 2018, the Company increased its commission rates in all Leading Markets, which is expected to have a ca. 5% positive effect on revenue growth for 2018 and onwards.
Takeaway.com N.V. (AMS: TKWY), hereinafter the “Company”, or together with its group companies the “Group” or “Takeaway.com”, the leading online food delivery marketplace in Continental Europe, hereby reports its financial results for the full year 2017 (unaudited). The Company will publish its annual report 2017 on Friday 16 March 2018.

• Takeaway.com aims for order growth to exceed 25% per annum in the medium-term (targeting greater than 30% compounded annual growth rate (CAGR) from 2015 to 2018);
• Takeaway.com aims to achieve a positive EBITDA margin for both its Germany segment and the Group as a whole within two to three years following its initial public offering; and
• Takeaway.com aims for adjusted EBITDA in the Netherlands to continue to increase. The Group's ability to achieve these objectives will depend upon a number of factors outside of its control, including significant business, economic and competitive uncertainties and contingencies.
Our people are critical to the success of our business and we made significant investments in our organisation during 2017. We strengthened our staff across all markets and at headquarter level, with year-end staff level increasing to 761 FTEs as at 31 December 2017 from 506 FTEs as at 31 December 2016. This excluded approximately 2,000 Scoober couriers, or 410 FTEs, as at the end of 2017.
The financial information included in the CFO update and financial review is derived from the condensed consolidated financial statements, as integrated into this document.
Condensed consolidated statement of profit or loss and other comprehensive income for the year ended 31 December

In 2017, Takeaway.com generated a total revenue of €166.5 million, a 49% increase from €111.6 million in 2016. This increase was the result of growth in orders and higher average commission rates in each of our Leading Markets.
Commission revenue was €149.7 million in 2017, representing 90% of total revenue compared with 89% in 2016. This increase was driven by higher average commission rates across all our markets, following an increase of our standard commission rates in all Leading Markets, except the Netherlands, from the start of 2017 and the increasing share of Scoober orders carrying higher commission rates. The average commission rate for the Group increased to 11.4% in 2017 from 10.6% in 2016.
As a result of further adoption of online payments by consumers, revenue from online payments increased to €12.0 million in 2017 from €8.1 million in 2016. The percentage of orders paid online increased to 54% in 2017 from 51% in 2016.
Cost of Sales and gross margin The Group’s cost of sales was €27.0 million in 2017, which represented a 73% increase from €15.6 million in 2016. The growth in cost of sales was significantly higher than the growth in orders as a result of the roll-out of Scoober, which added courier labour expenses of €11.2 million to the cost of sales in 2017, compared with €4.5 million in 2016. Excluding the impact of Scoober, cost of sales increased by 42% year-on-year, which was 7% below our revenue growth.
Staff costs Staff costs were €32.1 million in 2017, representing a 55% increase from €20.7 million in 2016. Excluding (oneoff) employee bonus share expenses, staff costs were €29.4 million in 2017 compared with €19.8 million in 2016, representing an increase of 48%. This increase is the result of significant investments in our organisation. We expanded our staff to manage our growth strategy and intensified our investments in our technology and product teams in order to innovate more rapidly. In addition, the listing of shares in the Company and increasing regulatory requirements necessitated further investment in headquarter staff, which is reflected both in the growth of FTEs as well as the increase of average staff costs per FTE. Apart from approximately 2,000 Scoober couriers, or 410 FTEs, as at the end of 2017, which are recorded in the cost of sales, the growth of our Scoober offering also required additional support and management staff in that area. Our staff, excluding couriers, increased to 761 FTEs as at 31 December 2017 from 506 FTEs as at 31 December 2016.
The aforementioned (one-off) employee bonus share expenses, which relates to cost of shares granted by a number of shareholders to employees at the initial public offering, were €2.7 million in 2017 compared with €0.8 million in 2016.
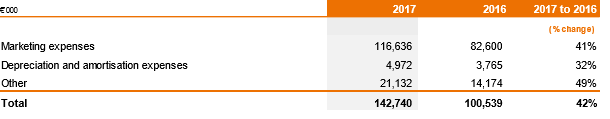
Other operating expenses comprise marketing expenses, depreciation and amortisation costs, housing expenses, other staff-related expenses, temporary staffing expenses, charges for doubtful debts, and other operating expenses.

The largest component of other operating expenses is marketing expenses. Marketing expenses increased by 41% to €116.6 million in 2017 compared with €82.6 million in 2016. This increase is the result of our strategy and intensified efforts after the initial public offering to further invest in market-leading positions in our Leading Markets, particularly in Germany and Poland. Marketing expenses as a percentage of revenue improved in all segments in 2017, reflecting the scale benefits of our business.
Our depreciation and amortisation expenses were €5.0 million in 2017, which represented a 32% increase from €3.8 million in 2016. This related primarily to the amortisation of intangible assets recognised as the result of the acquisitions of Yourdelivery (Lieferando.de and Pyszne.pl) in 2014 and Just Eat Benelux in 2016.
Other operating expenses were €21.1 million in 2017, which represented a 49% increase from €14.2 million in 2016. This increase was mainly driven by additional staff-related expenses in line with growth in FTEs and investments in new organisational systems.
Long-term employee incentive costs Long-term employee incentive costs relate to the fair value expense of share-based payments for employees in a particular year. Our long-term employee incentive costs were €1.9 million in 2017, up from €0.2 million in 2016. The main driver for this increase in 2017 was the introduction of an Employee Share and Option Plan (ESOP), which was granted to our key senior and mid-level management.
Due to the termination of the overdraft facility, revolving credit facility, and bridge loan agreement after the initial public offering in September 2016, our finance costs decreased to €0.2 million in 2017 compared with €1.8 million in 2016.
At year-end, Takeaway.com owned 66% of Takeaway.com Asia BV, which in turn owns 99% of the shares and voting rights of Vietnammm. Takeaway.com Asia BV is accounted for as a joint venture using the equity method of accounting given that joint control exists in terms of decision-making. Takeaway.com’s share of loss in the joint venture was €0.2 million in 2017 compared with €0.1 million in 2016. Takeaway.com may, pursuant to the shareholders’ agreement in respect of Takeaway.com Asia B.V., be required to purchase the remaining shares in such company from its joint venture partner as of 1 July 2018.
The Group’s income tax expense amounted to €4.4 million in 2017 compared with €3.6 million in 2016. This increase was due to higher taxable profits in our Dutch fiscal unity. Takeaway.com has historically not been profitable in its non-Dutch entities and, as a result, has accumulated tax losses in these entities which can be carried forward to offset future taxable income, if any and if not expired in the relevant countries.
As a result of the factors described above, the Group incurred a net loss of €42.0 million in 2017, representing a 36% increase from a loss of €30.9 million in 2016. Condensed consolidated statement of financial position

Non-current assets, mainly consisting of goodwill, other intangible assets, and property and equipment, decreased to €91.5 million as at 31 December 2017.
Changes in working capital can vary in the short term, as payments from restaurants are received on a daily basis while we pay restaurants on a weekly basis, but changes in working capital are generally insignificant over the course of a particular year. Operating working capital is structurally negative due to the difference between the restaurant and consumer payment cycles. Operating working capital amounted to minus €25.7
million as at 31 December 2017 compared with minus €21.5 million2 as at 31 December 2016, a decrease of €4.2 million, driven primarily by the timing of restaurant and other creditor payments.
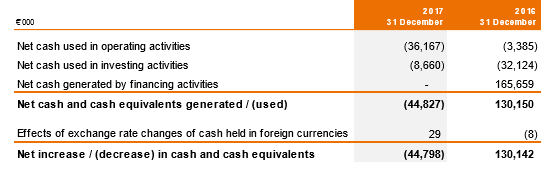
Cash and cash equivalents were €89.8 million at year-end 2017 from €134.6 million at year-end 2016, a decrease of €44.8 million. This was driven by net cash of €36.2 million used in operating activities, primarily reflecting the net loss for the period of €42.8 million, net cash used in investing activities driven mainly by the payments of the hold-back in relation to the Just Eat Benelux acquisition, which was completed in August 2016, and the share-based payment taxes of 2016 as well as capital expenditures made in 2017.
Shareholders’ equity decreased to €149.8 million at year-end 2017 from €187.8 million at year-end 2016, following the allocation of the loss for the year 2017 to shareholders’ equity

Net cash used in operating activities amounted to €36.2 million in 2017 compared with €3.4 million in 2016. The increase in net cash used in operating activities was driven primarily by our greater operating losses, change in working capital position, mostly related to timing of creditor payments, as well as a one-off payment of taxes of €6.3 million related to options exercised during the initial public offering which was received in 2016 but paid in 2017.
Net cash flow used in investing activities was €8.7 million in 2017, principally related to the hold-back payment in relation to the Just Eat Benelux acquisition of €4.4 million as well as capital expenditures made in relation to office space and IT infrastructure.
No cash was generated by financing activities in 2017 compared with €165.7 million in 2016. The net cash generated by financing activities in 2016 was fully attributed to the net proceeds of the initial public offering of ordinary shares of the Company in 2016.

In the Netherlands, Takeaway.com processed 27.4 million orders in 2017, representing a growth rate of 30% compared with 2016. Gross Merchandise Value (GMV) grew by 32% during that same period, slightly affected by the increasing share of Scoober orders which usually carry a higher basket value. Revenue in the Netherlands grew by 35% to €74.4 million in 2017 from €55.3 million in 2016, outpacing order growth. This increase was driven by a slight increase in the average commission rate, reflecting primarily the increased share of Scoober orders, as well as an increase in online payments to 73% in 2017 from 67% in 2016.
In the Netherlands, marketing expenses as a percentage of revenue remained stable at 18% compared with 2016. Our scale benefits partly offset the increase in our cost base as a result of the growth of our Scoober business and investments to further professionalise our organisation in line with our guidance at the time of the initial public offering. Adjusted EBITDA, including allocated headquarter expenses, increased to €43.0 million in 2017 compared with €34.7 million in 2016. This resulted in an adjusted EBITDA margin of 58% in 2017 compared with 63% in 2016.
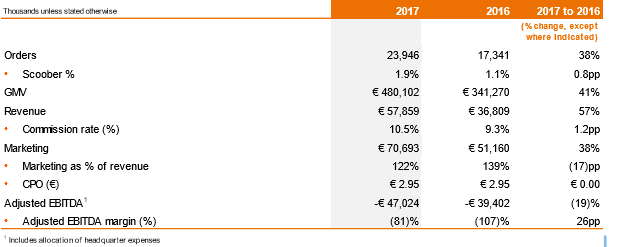
Orders processed in Germany grew by 38% during 2017 compared with 2016. GMV grew by 41% during the same period, driven primarily by the increasing share of Scoober orders which usually carry a higher basket value. Revenue in Germany grew to €57.9 million in 2017 from €36.8 million in 2016, representing a 57% increase and demonstrating the strong revenue generating capability. The reason for the revenue growth in
excess of order growth was the increased average commission rate following the standard commission rate increase from January 2017.
In Germany, marketing costs as a percentage of revenue improved to 122% in 2017 from 139% in 2016, as revenue growth exceeded the rate of increase of marketing expenditures. The adjusted EBITDA decreased to minus €47.0 million in 2017 compared with minus €39.4 million in 2016. However, our adjusted EBITDA margin in Germany improved in 2017 compared with 2016, driven by significant revenue growth.
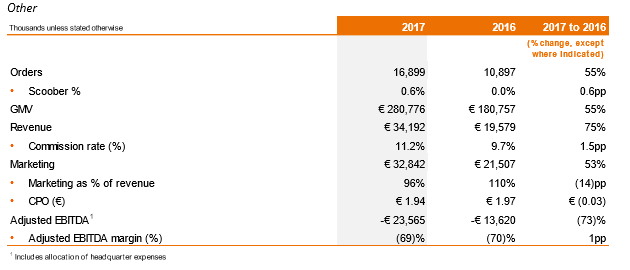
Orders processed in the Other segment (which includes Poland, Belgium, Austria, France, Switzerland, Portugal, Luxembourg and, until August 2016, the United Kingdom) increased by 55% to 16.9 million in 2017 compared with 10.9 million in 2016, driven primarily by high growth in Poland, Belgium and Austria. Revenue in the segment grew by 75% to €34.2 million in 2017 from €19.6 million in 2016. The substantial growth in revenue as compared to GMV and order growth reflected an increase in the average commission rate driven by standard commission rate increases in Poland, Belgium and Austria from January 2017, as well as growth in Scoober orders.
In the Other segment, marketing expenses as a percentage of revenue improved to 96% in 2017 compared with 110% in 2016, despite higher brand awareness marketing expenditures in Poland, which we view as strategic given the low penetration and high growth rates in Poland and, to a lesser extent, marketing expenditures increased in Belgium and Austria. The adjusted EBITDA margin slightly improved in 2017 compared with 2016, driven by increased revenue.
In order to concentrate on sustainable market leading positions, Takeaway.com ceased its operations in France effective as of the beginning of February 2018. The impact on Group results and the segment Other will be immaterial.
In February 2018, Takeaway.com signed an agreement to acquire the food delivery marketplaces BGmenu in Bulgaria and Oliviera in Romania. BGmenu is the market leader in food delivery in Bulgaria in terms of orders. Oliviera is one of the largest food delivery marketplaces in Romania. The acquisition is in line with our strategy to further expand its leadership positions in the European market and drive sustainable leadership positions. The acquisition will further enhance our market leading positions in Continental Europe. Both Bulgaria and Romania are fast-growing online food delivery markets with a sizeable addressable population that offer attractive long-term growth potential. We will significantly invest in the acquired businesses to further support growth. Upon the date of acquisition, Bulgaria and Romania will be included in the Other segment.
Management decided to rename the Other segment into Other Leading Markets from 2018 onwards, in order to better reflect the strong and market leading positions in Poland, Belgium and Austria.
To maintain our strong growth, we will continue to invest significantly in our offering to consumers and restaurants, in conformity with the guidance given by the Company at our full year results announcement. We will do this through investments in marketing, product development, expansion of Scoober, recruitment of staff at all levels and organisational infrastructure. As a result, we anticipate a loss at Group level for the year 2018 but expect the absolute amount of future losses to decrease going forward.
The risks outlined in the 2016 Annual Report continued to apply in the 2017. The key operational risks we face are as follows:
• Our ability to maintain and improve our competitive position and its effect on marketing expenses;
• Our ability to keep pace with long-term developments in website and mobile applications and ecommerce relative to our competitors;
In 2017, Takeaway.com significantly invested in its risk and control function, implementing several new processes in order to strengthen the control environment. The Management Board, having responsibility for risk management with oversight from the Supervisory Board, believes that Takeaway.com's risk management framework operated effectively in 2017. The Management Board believes that all the aforementioned risks were effectively mitigated within the boundaries of our risk appetite and is not aware of any incidents that substantially impacted the business during this period. For further details on the mitigating factors and potential impacts related to these risks, as well as developments in each risk during 2017, please refer to the 2017 Annual Report which will be published on 16 March 2018